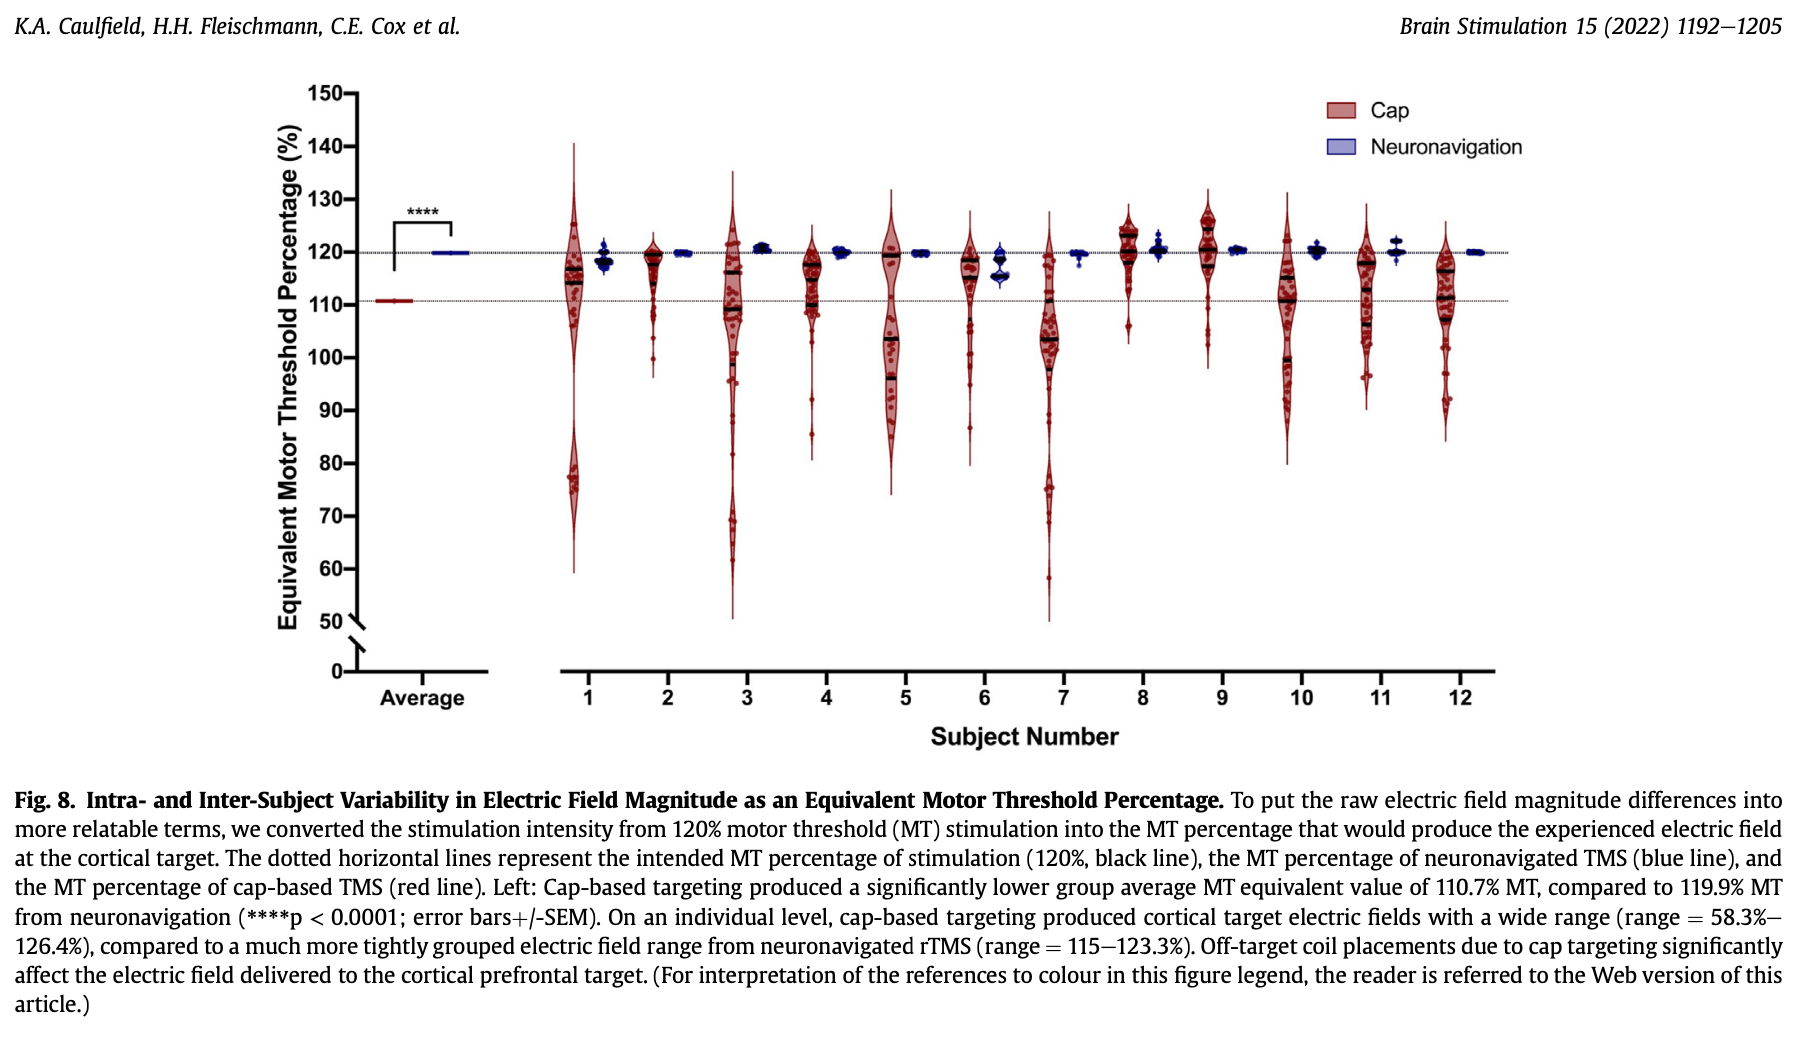
To put the raw electric field magnitude differences into more relatable terms, we converted the stimulation intensity from 120% motor threshold (MT) stimulation into the MT percentage that would produce the experienced electric field at the cortical target. The dotted horizontal lines represent the intended MT percentage of stimulation (120%, black line), the MT percentage of neuronavigated TMS (blue line), and the MT percentage of cap-based TMS (red line). Left: Cap-based targeting produced a significantly lower group average MT equivalent value of 110.7% MT, compared to 119.9% MT from neuronavigation (****p < 0.0001; error barsþ/-SEM). On an individual level, cap-based targeting produced cortical target electric fields with a wide range (range 1⁄4 58.3%e 126.4%), compared to a much more tightly grouped electric field range from neuronavigated rTMS (range 1⁄4 115e123.3%). Off-target coil placements due to cap targeting significantly affect the electric field delivered to the cortical prefrontal target. (For interpretation of the references to colour in this figure legend, the reader is referred to the Web version of this article.)